Hough Transform (numpy)
python example :
import numpy as np
import math
import cv2
def hough_line(img, angle_step=1, lines_are_white=True, value_threshold=5):
"""
Hough transform for lines
Input:
img - 2D binary image with nonzeros representing edges
angle_step - Spacing between angles to use every n-th angle
between -90 and 90 degrees. Default step is 1.
lines_are_white - boolean indicating whether lines to be detected are white
value_threshold - Pixel values above or below the value_threshold are edges
Returns:
accumulator - 2D array of the hough transform accumulator
theta - array of angles used in computation, in radians.
rhos - array of rho values. Max size is 2 times the diagonal
distance of the input image.
"""
# Rho and Theta ranges
thetas = np.deg2rad(np.arange(-90.0, 90.0, angle_step))
width, height = img.shape
diag_len = int(round(math.sqrt(width * width + height * height)))
rhos = np.linspace(-diag_len, diag_len, diag_len * 2)
# Cache some reusable values
cos_t = np.cos(thetas)
sin_t = np.sin(thetas)
num_thetas = len(thetas)
# Hough accumulator array of theta vs rho
accumulator = np.zeros((2 * diag_len, num_thetas), dtype=np.uint8)
# indices of none zero (row, col)
are_edges = img > value_threshold if lines_are_white else img < value_threshold
y_idxs, x_idxs = np.nonzero(are_edges)
# Vote in the hough accumulator
for i in range(len(x_idxs)):
x = x_idxs[i]
y = y_idxs[i]
for t_idx in range(num_thetas):
# Calculate rho. diag_len is added for a positive index
rho = diag_len + int(round(x * cos_t[t_idx] + y * sin_t[t_idx]))
accumulator[rho, t_idx] += 1
return accumulator, thetas, rhos
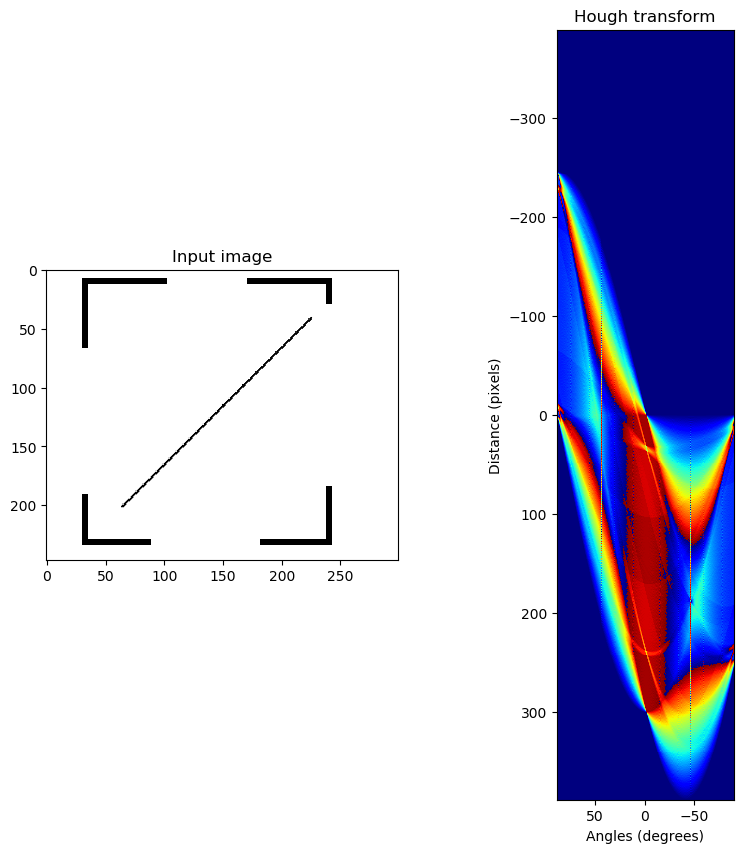
def show_hough_line(img, accumulator, thetas, rhos, save_path=None):
import matplotlib.pyplot as plt
fig, ax = plt.subplots(1, 2, figsize=(10, 10))
ax[0].imshow(img, cmap=plt.cm.gray)
ax[0].set_title('Input image')
ax[0].axis('image')
ax[1].imshow(
accumulator, cmap='jet',
extent=[np.rad2deg(thetas[-1]), np.rad2deg(thetas[0]), rhos[-1], rhos[0]])
ax[1].set_aspect('equal', adjustable='box')
ax[1].set_title('Hough transform')
ax[1].set_xlabel('Angles (degrees)')
ax[1].set_ylabel('Distance (pixels)')
ax[1].axis('image')
# plt.axis('off')
if save_path is not None:
plt.savefig(save_path, bbox_inches='tight')
plt.show()
if __name__ == '__main__':
imgpath = 'imgs/line.png'
img = cv2.imread(imgpath, 0)
cv2.imshow('', img)
cv2.waitKey()
accumulator, thetas, rhos = hough_line(img)
show_hough_line(img, accumulator, thetas, rhos, save_path='imgs/output.png')output:
Reference